The Evolution of Dams – Changing Water Levels – Lower Magaguadavic River & Lake Utopia Background
Our Members frequently pose questions, and express concerns as to water levels at Lake Utopia, and the Lower Magaguadavic River.
Since the first dams on the Magaguadavic system in the late 1700’s, the water levels at Lake Utopia, and on the River from Second Falls to the Dam at St. George, have been held at varying degrees of an artificially created headpond.
Today, Lake Utopia is generally held in the range of 55 to 59 feet of elevation above mean sea level.
At 59 feet the Lake is full, and with any further increase, the Lake advances into the vegetation level, and flood stage.
Under normal river flow levels, there is generally a 1 foot lower elevation differential between the Lake, and the level at the Dam in St. George.
In the range of 55 to 59 feet, the Headpond level at the lake is estimated to be from 10 to 14 feet higher than the levels would have existed before the first dams.
The most frequent issues of concern center around the impact higher water levels have on flood mitigation, land erosion, fish and waterfowl populations, and residential and recreational values.
Through the use of Historical Images we will now provide further background on the earlier information posted under the topic “A Chronology of Events Related to Dams on the Magaguadavic River”.
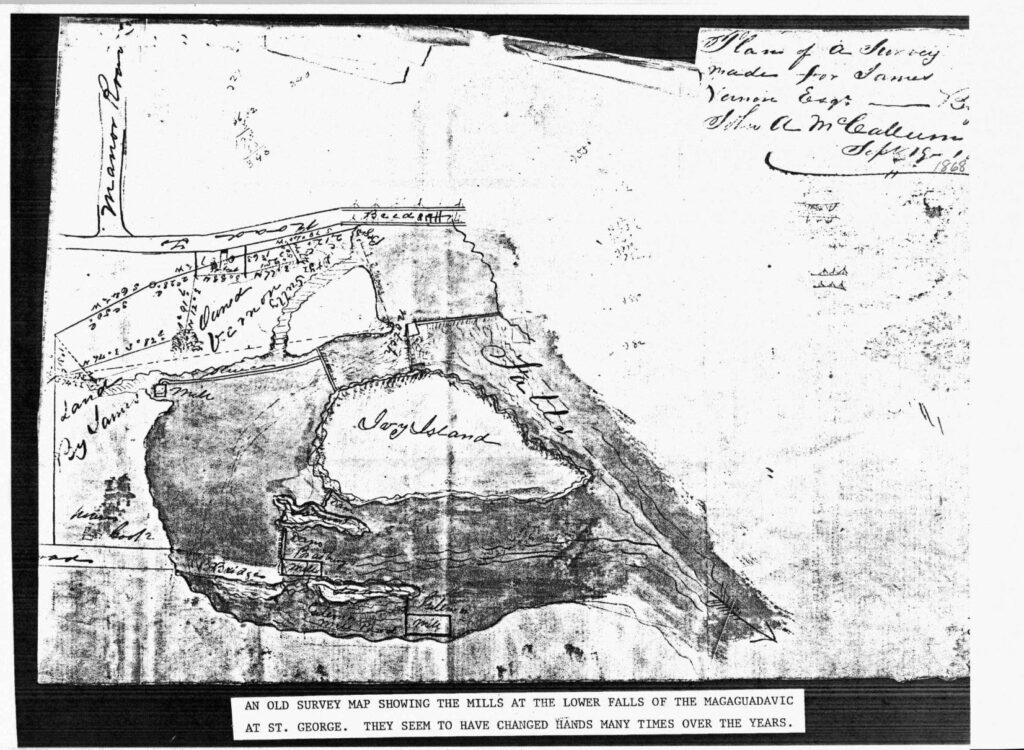
Early images indicate that previous to dams being present at the gorge in St. George, the gorge consisted of 2 principal channels, an eastern one where today the Fish Ladder is located, and the western where today the St. George Power dam is located.
These channels flowed around an island, later to become known as “Ivy Island”.
A third and lessor known channel also existed around a small island like rock formation, and was located across the street from where today Granite Town Farms exists.
This third channel was dry most of the year, and would later be filled in by rock debris from the Granite Industry.
The 1868 Surveyors sketch below illustrates an early lay out of Dams and the river channels at St. George. (Image courtesy of Charlotte County Archives)
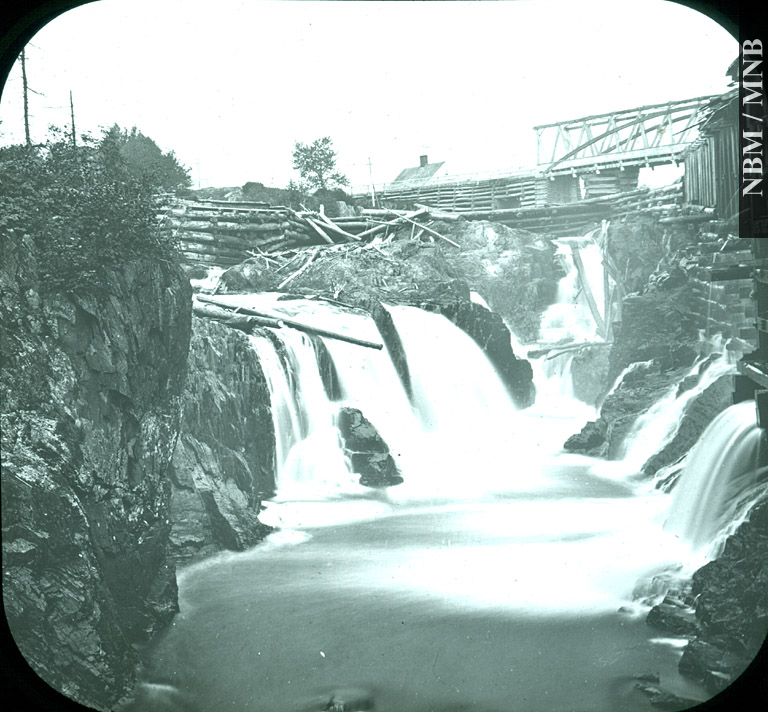
The early dams were crude crib work structures of only a few feet in height, and were frequently washed out by freshet. The one pictured below from c1890 was in the Eastern Channel where today the main 1950 dam, and the Fish Ladder exist.
Through the years, the dams in the Eastern Channel have acted as the primary structure to elevate upstream levels, and to divert water flow into the western channel around Ivy Island.
In the early years from after 1783, and up until the coming of the Granite Industry c1872, the primary industry in St. George was located in the western channel, which would become known locally as “The Gully”.
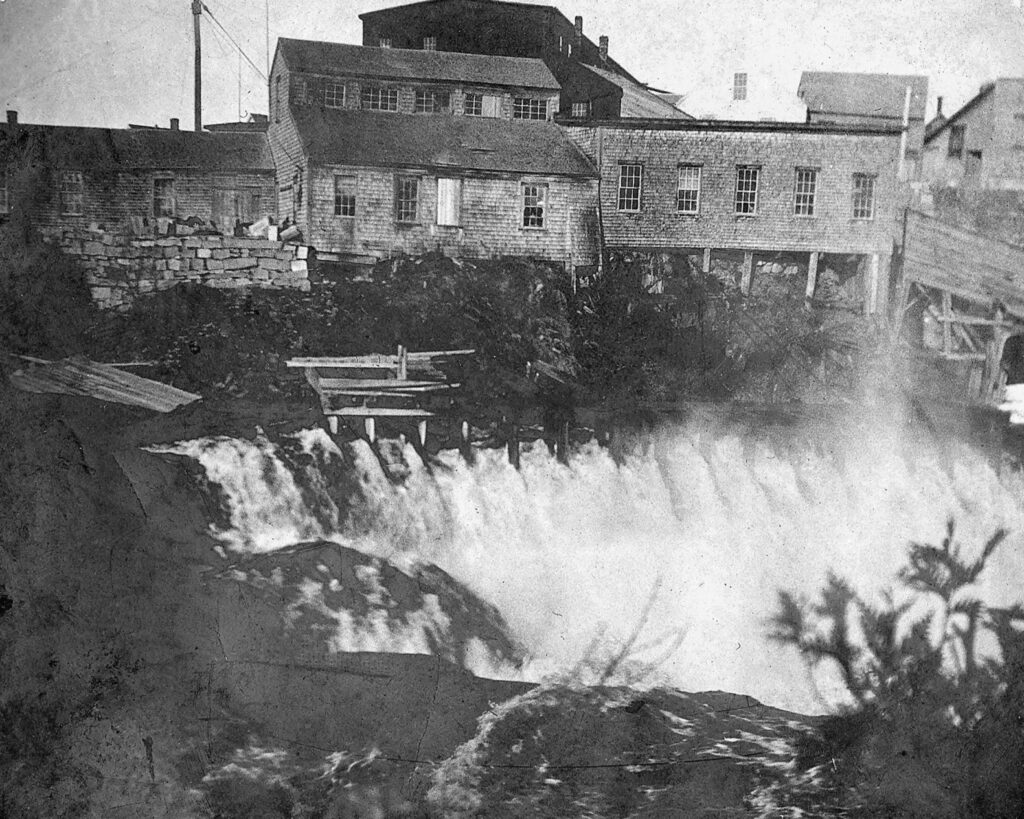
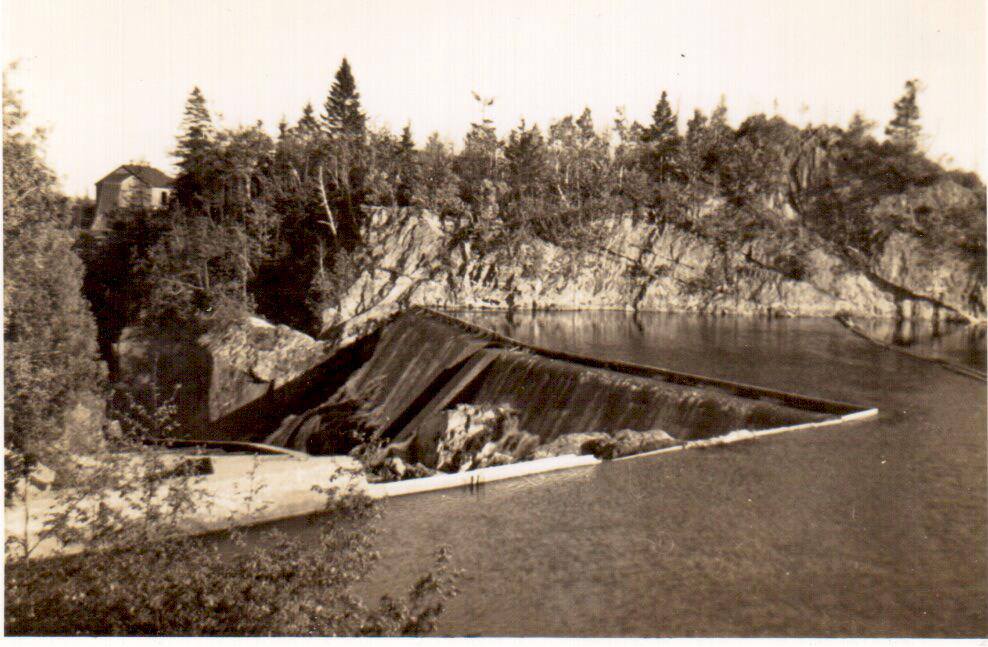
The early Sawmills, and Grist Mills were located here, and were powered by water wheels in low elevation Dam structures. This early industry was located in the approx. location of todays St. George Power dam and forebay area. The image below c1880’s, depicts the downstream side of an early dam in the Western Channel.
The photographer would be standing in the approx. location of the Old Red Mill in the St. George Gorge. In the upper left the image captures the sluiceway which was used to sluice finished lumber to ships in the Basin.
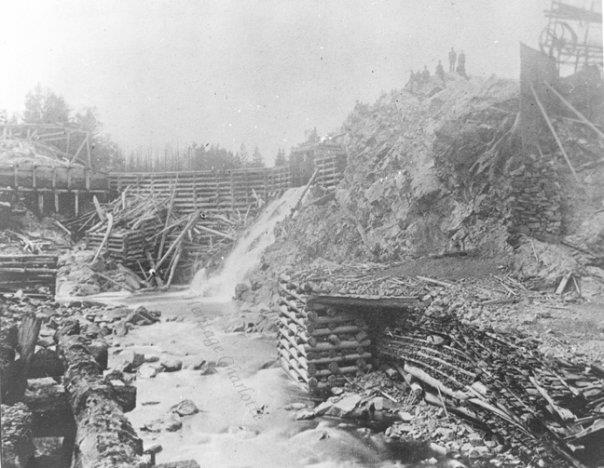
In the early 1870’s the Granite Industry became established in St. George. The image below c1900 shows a cluster of Granite Sheds which were located on the eastern channel. Today the building in the foreground is where the parking lot for the Dam by the upper bridge is located. This image was probably taken after a freshet had swept away the low elevation dam of the period.
Where the water is cascading through the pilings would be the remnants of a sluiceway to power the waterwheels.
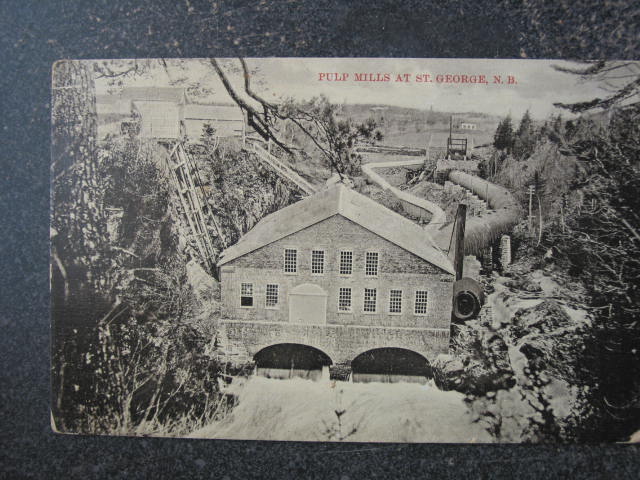
With the advent of the Pulp and Paper Mill in 1901, the industry footprint, and dam location in the Western Channel was radically changed. The former lumber mills, Granite Shed, etc. were eliminated or relocated.
The upper end of the Penstock Pipe in this picture represents approx. where today’s St. George Power dam is located. With the 1901 changes, the former dam location in this channel was reoriented to run in more of an East / West direction versus the former North / South.
As well this dam was higher in elevation than the previous to provide more water power advantage for the Mill machinery. The level of the upstream head pond was increased significantly with these changes.
As this dam, and the previous dams in the western channel became more effective at capturing and storing water, upstream passage for migrating fish species such as Atlantic Salmon and Sturgeon became increasingly more difficult.
Between 1901 and the early 1920’s, following successive loses of wooden cribwork dams due to freshet, newer dams would increasingly utilize concrete in construction and become more effective at storing water.
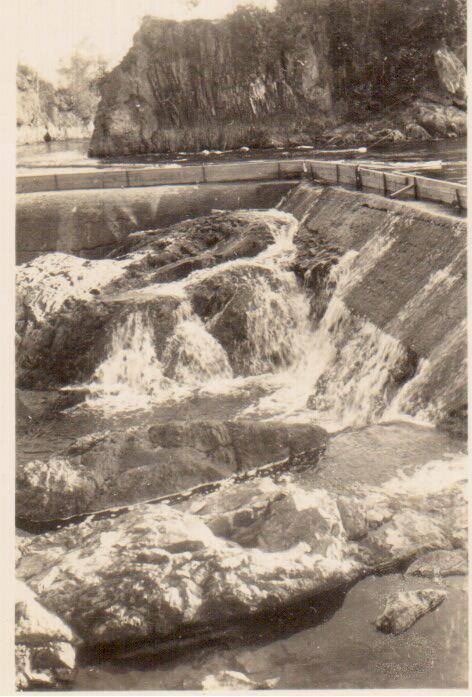
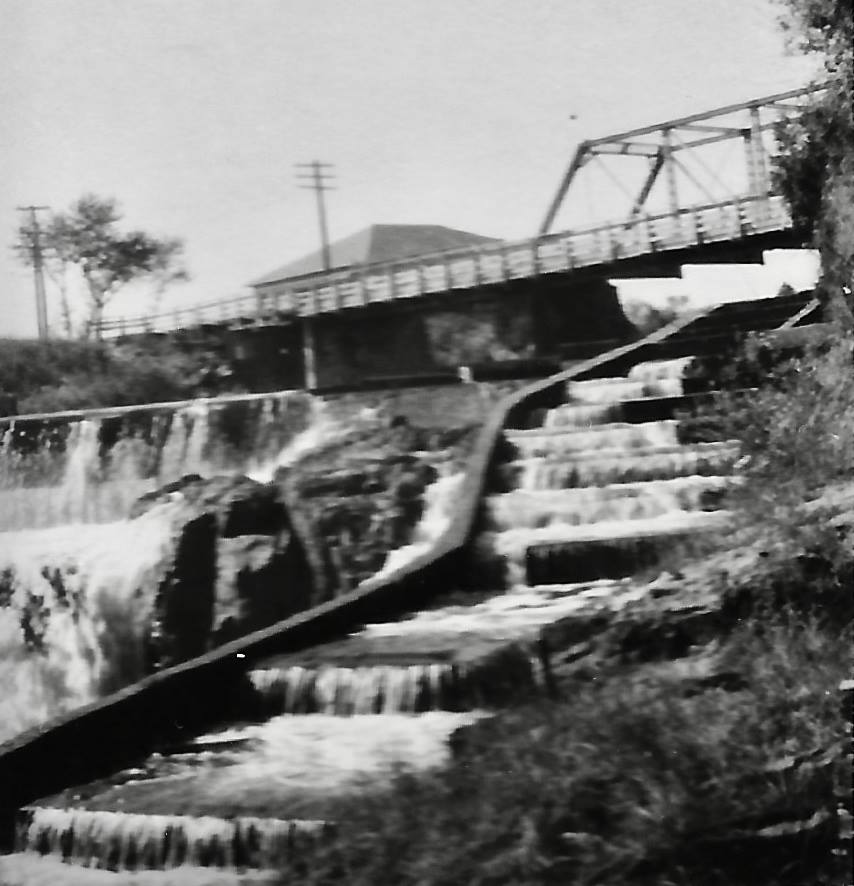
By the early 1920’s all migration of species such as Atlantic Salmon, Gaspereau, and Sturgeon had ceased. The men in the first picture are standing where the Fish Ladder is located today.
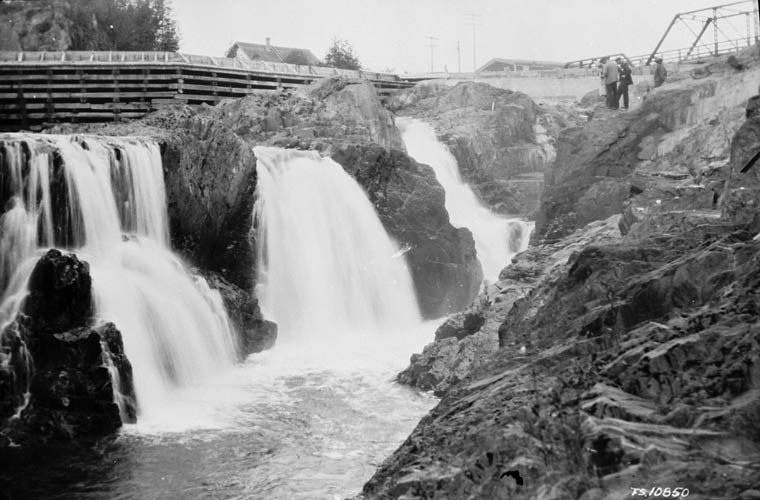
In 1926 a Fishway (lower 2 pictures) was added, and the River was restocked with the Saint John River strain of the Atlantic Salmon. Gaspereau runs returned on their own, but the Sturgeon did not return to the system.
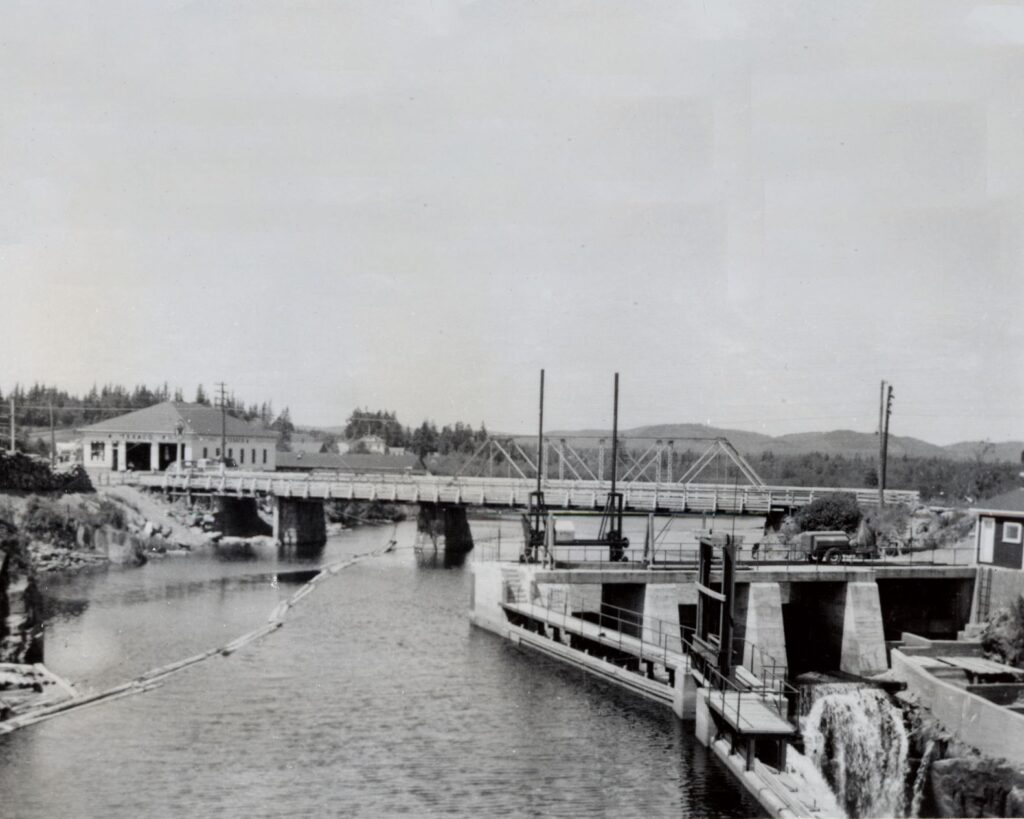
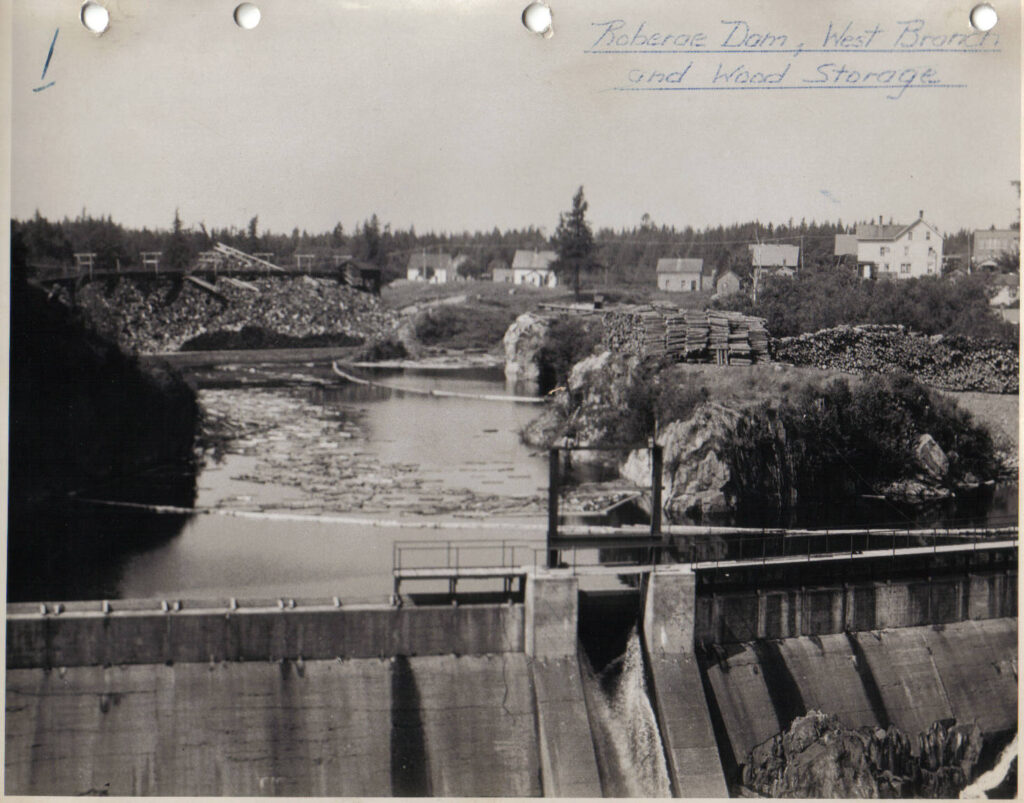
1950 would bring the construction of the dam on the eastern channel which is there today. This dam would increase the upstream head pond level by 10 feet.
A further increase to the height of the spillway wing of this dam in 1952 would add another 4 foot of head pond elevation.
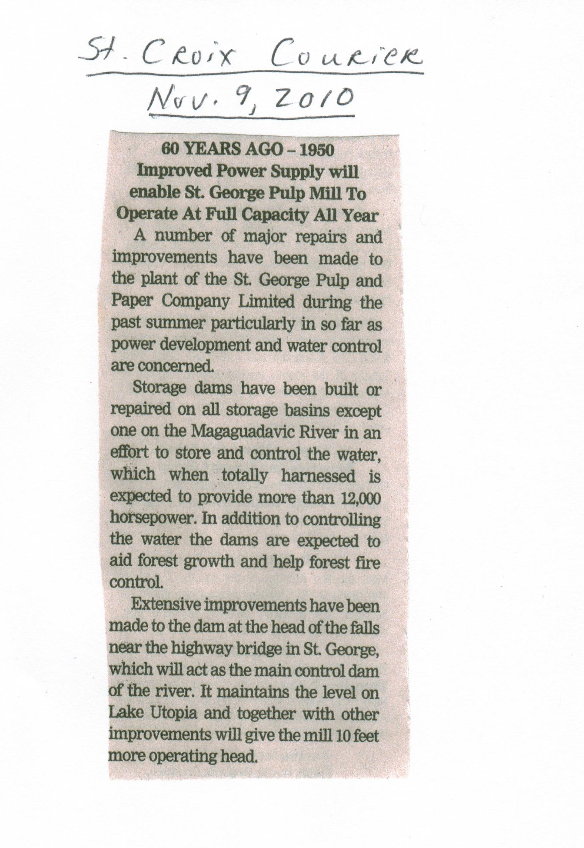
As noted previously, in 1950 and 1952 the water levels at Lake Utopia would change radically upwards, and would remain at those elevated levels until present day. Compared to pre dam levels in 1783, there would be an increase in the range of 10 to 14 feet of water level elevation at Lake Utopia.
The series of pictures below will illustrate the changes which have taken place since 1941.
First a series from the Canal Beach Area.
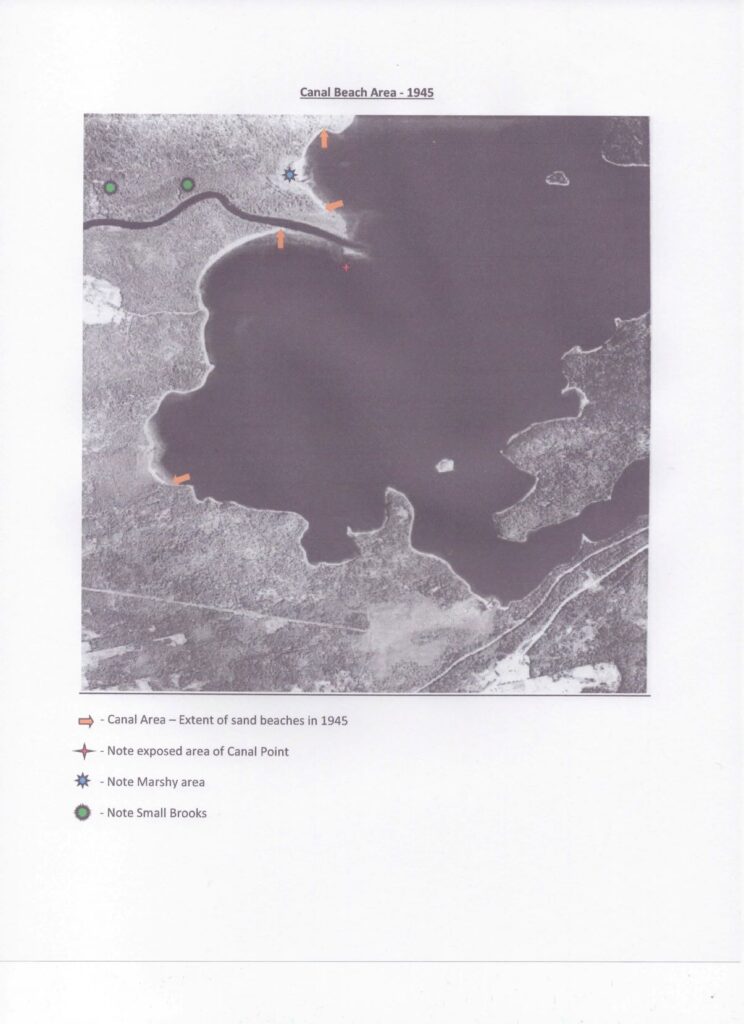
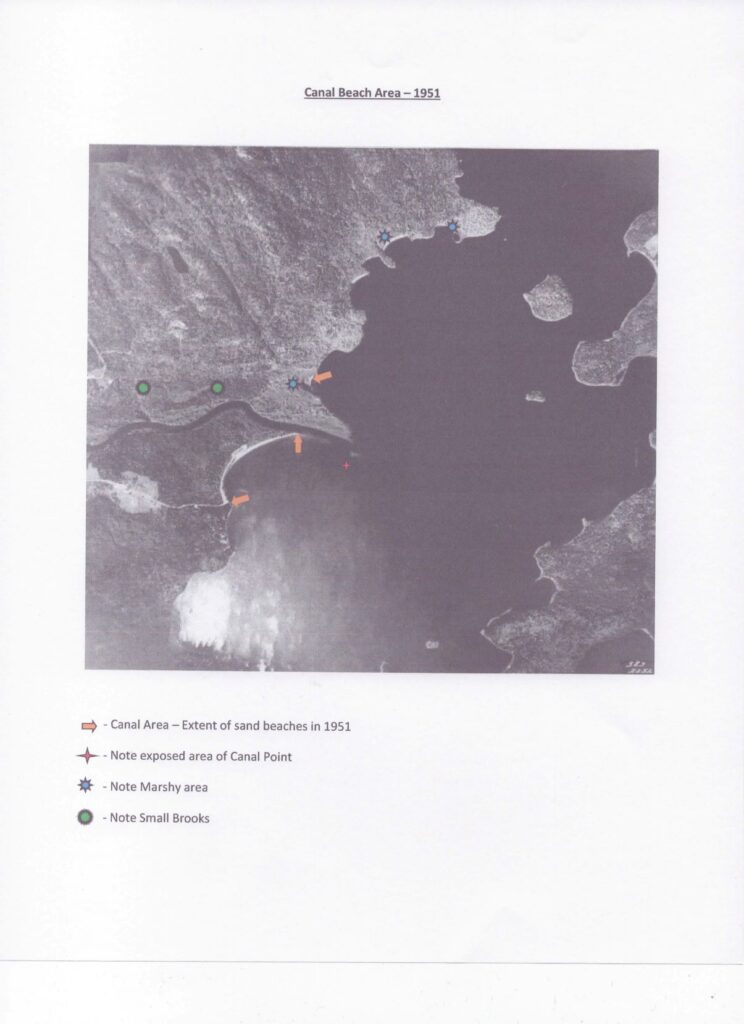
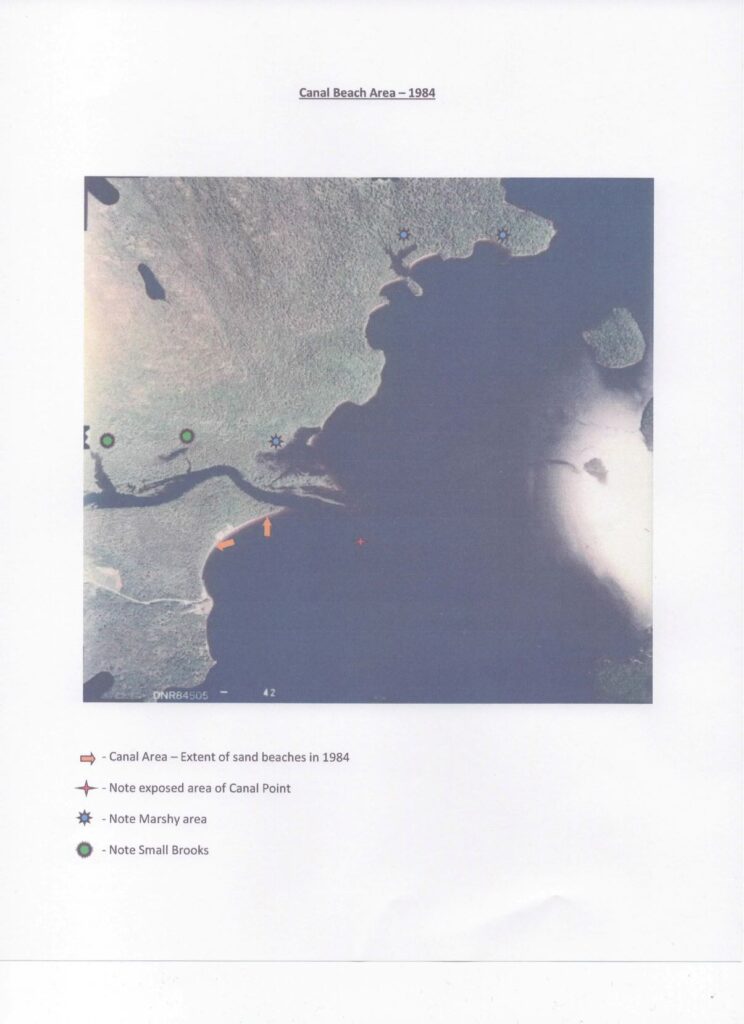
(All the aerial photos are from Natural Resources Canada with notations by LUPA)
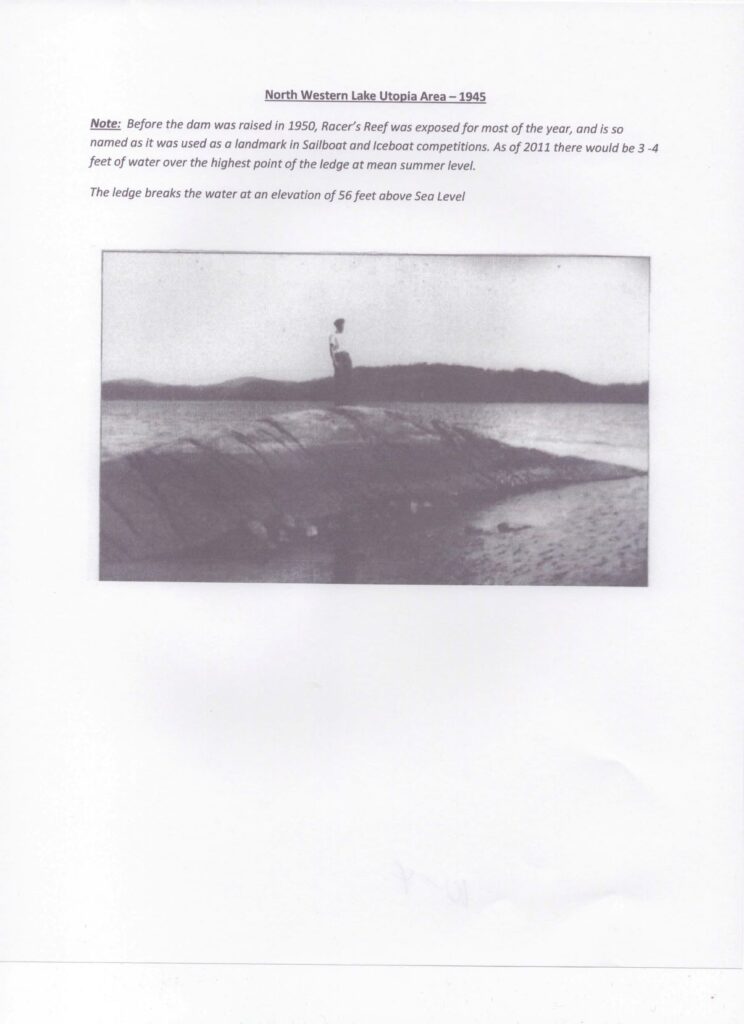
A series of photos from the Northwestern Area of Lake Utopia.
Note in particular the changes to Racer’s Reef, the large ledge to the Northwest of Long Island. Today this ledge is submerged for most of the year, and does not surface until water level reaches approx. 56 feet.
Also see the changes to the camp and beach area adjacent to the 1st Smelt Brook. In particular how much of the large rock at the end of the Smelt Brook Beach is now submerged.
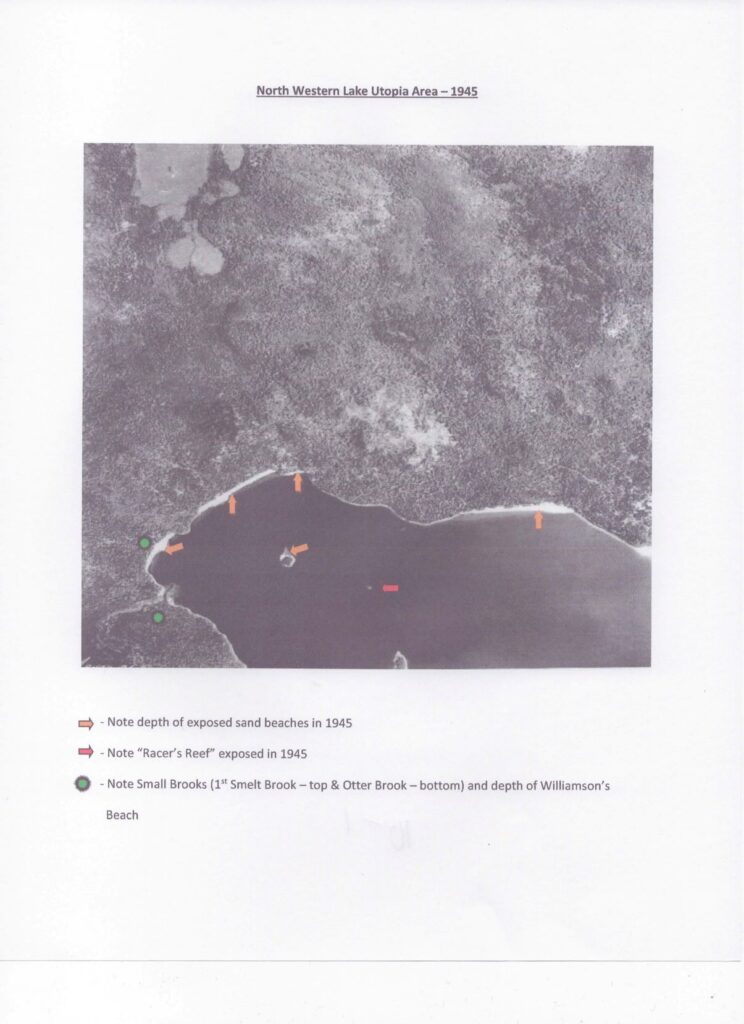
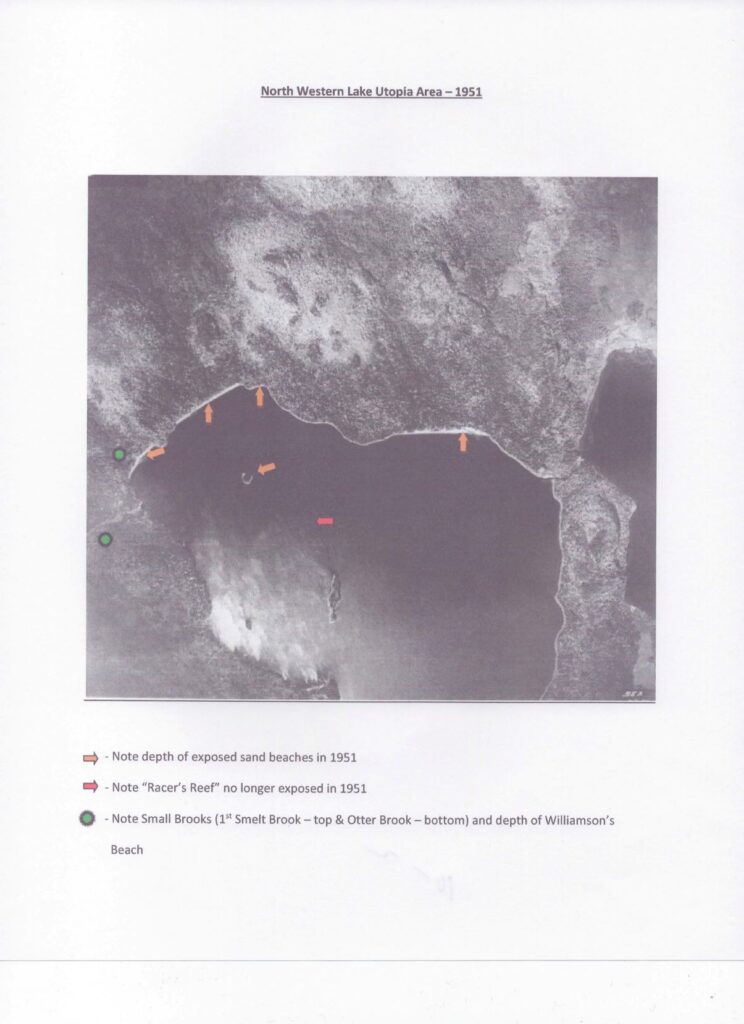
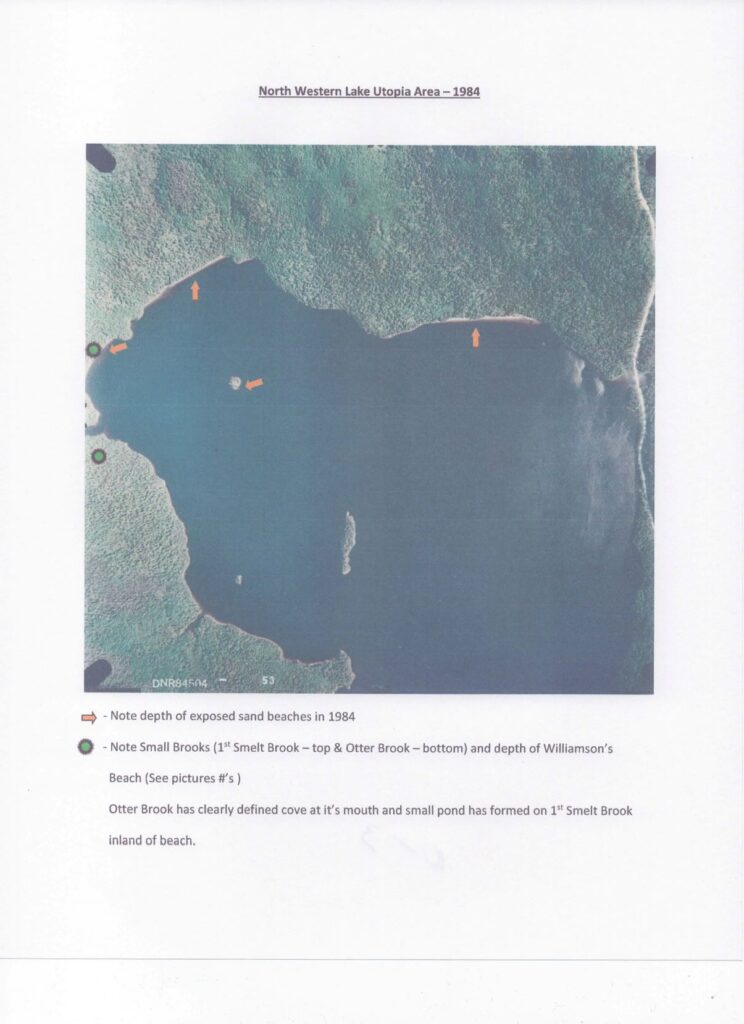
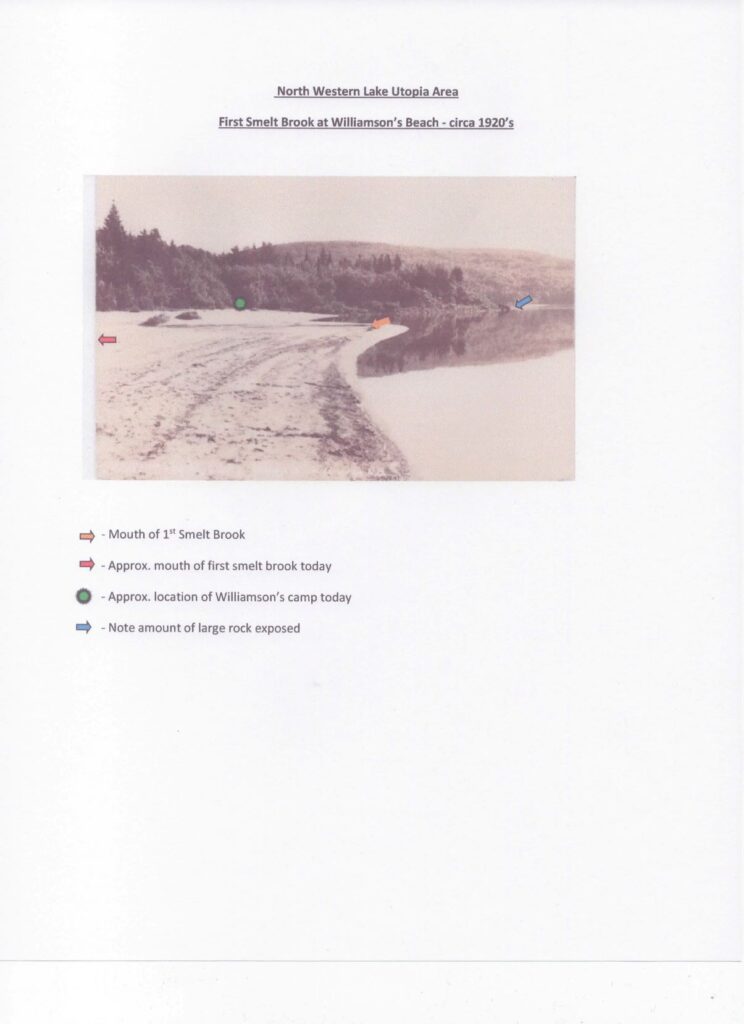
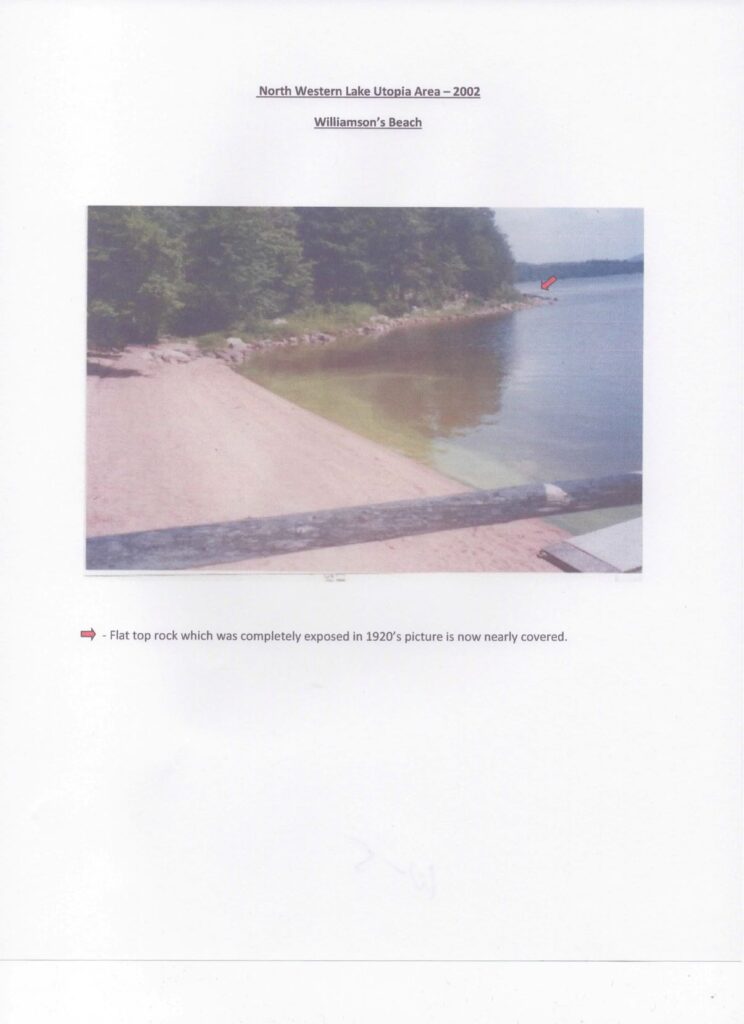
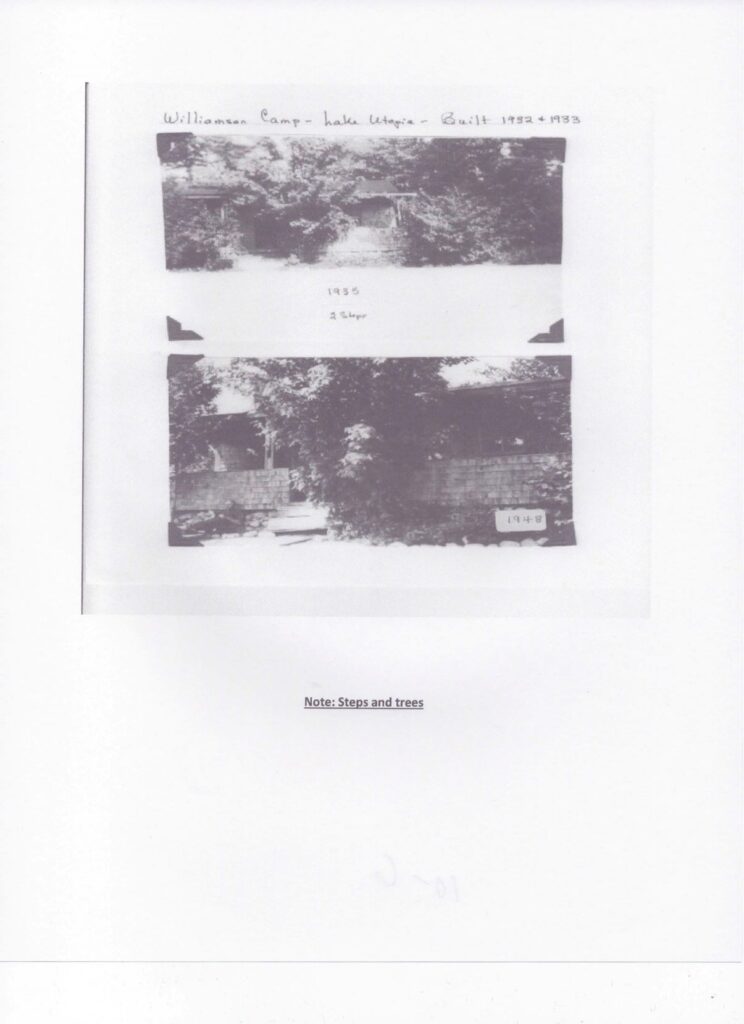
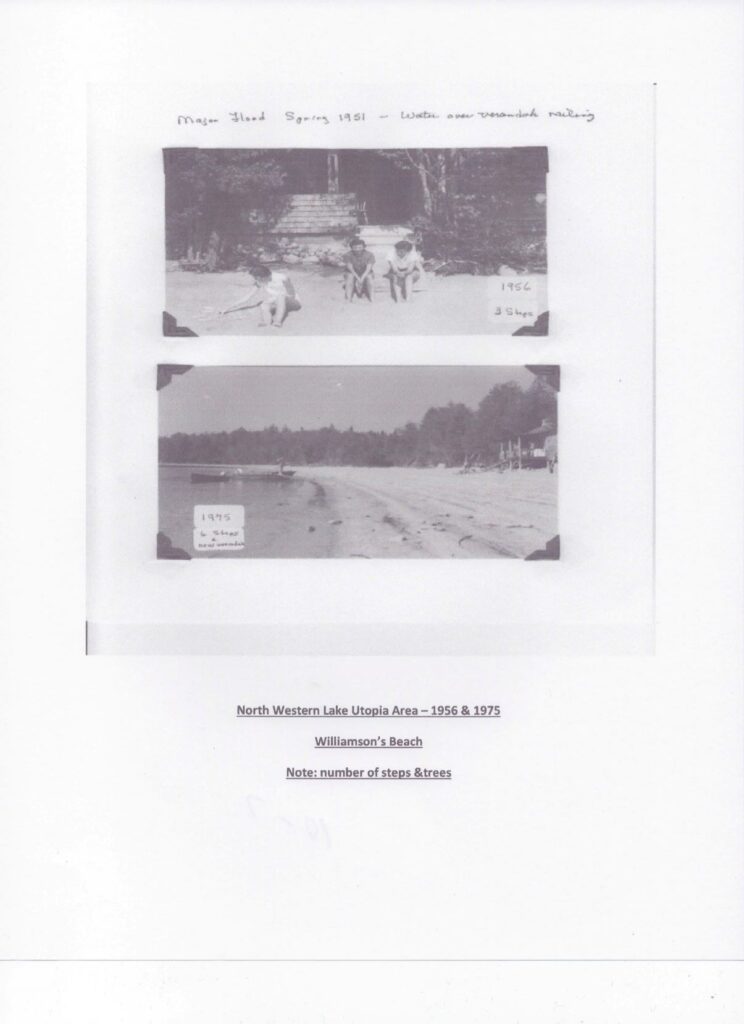
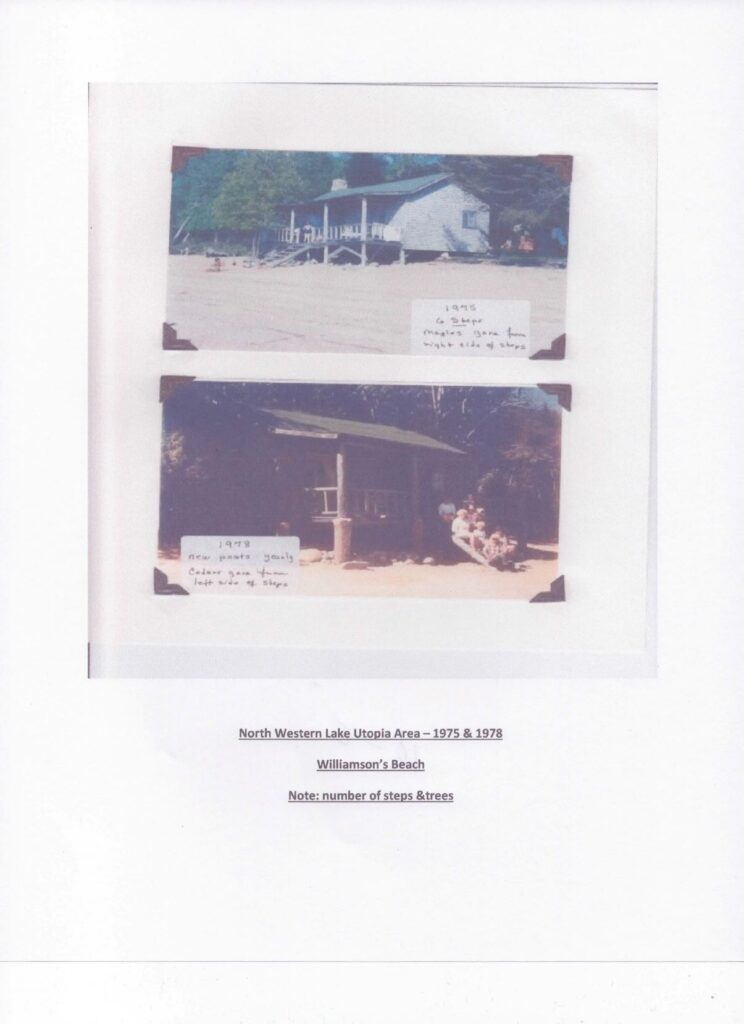
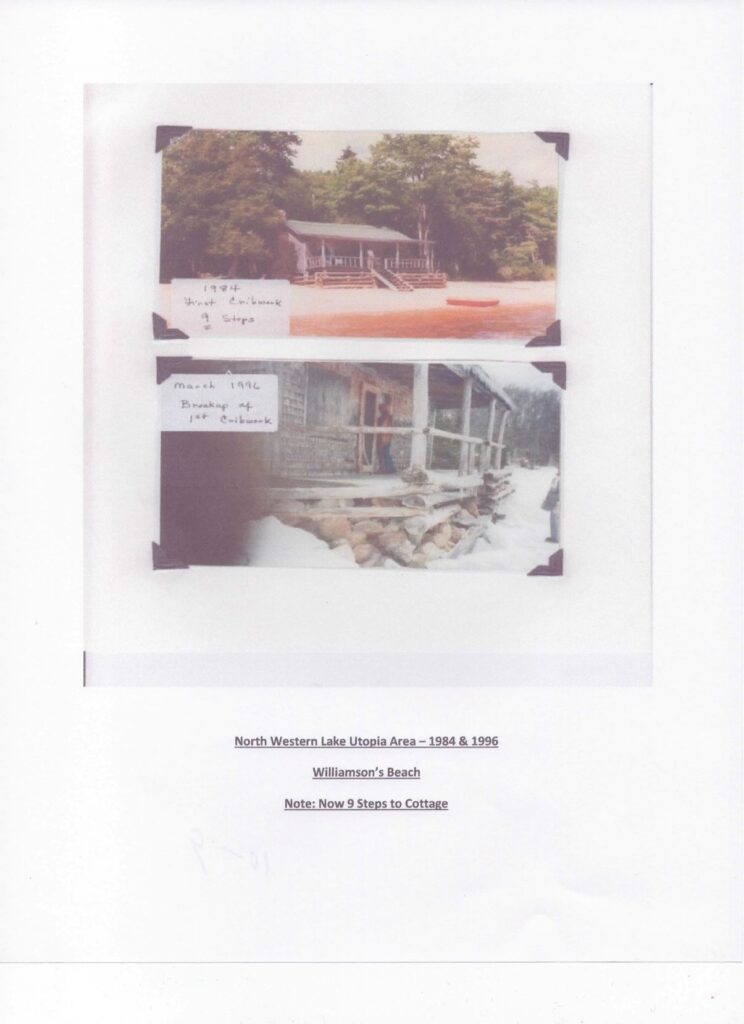
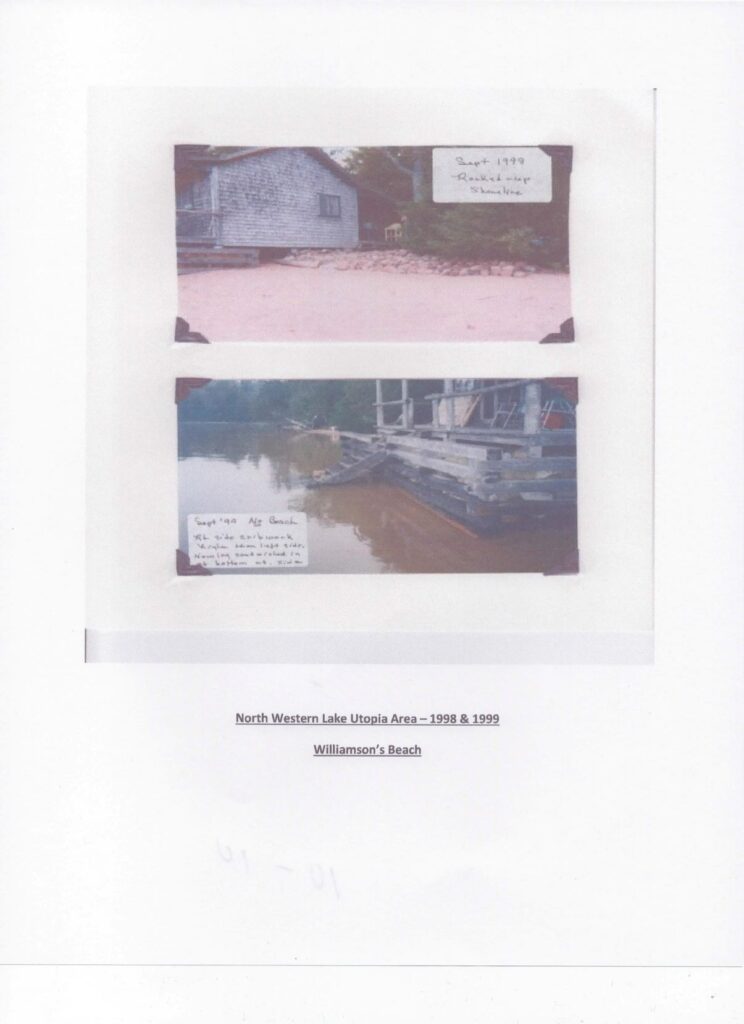
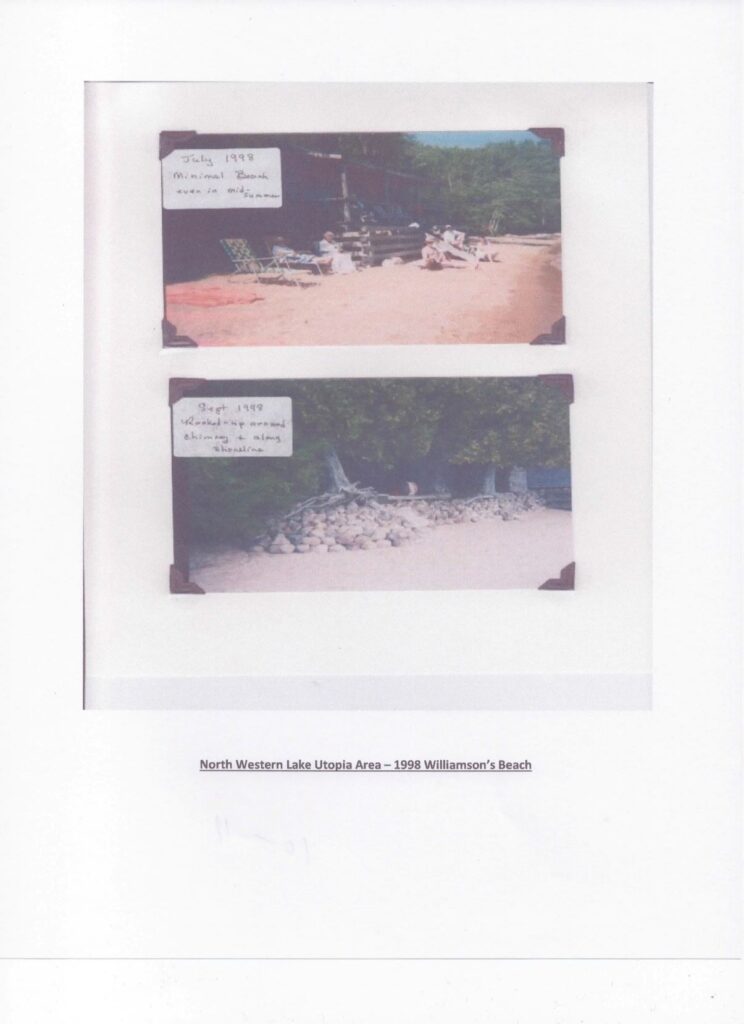
The shoreline in the area of First Smelt Brook, and the Williamson Cottage has experienced significant erosion from higher water levels, resulting in loss of vegetation, and the beach sand being washed outward into the lake resulting in need for additional cottage steps.
(Aerial Pictures from Natural Resources with Notations by LUPA. The Beach / Shoreline images courtesy of The Williamson Family).
And finally some images from the Woodbury’s Cove area of the Lake.
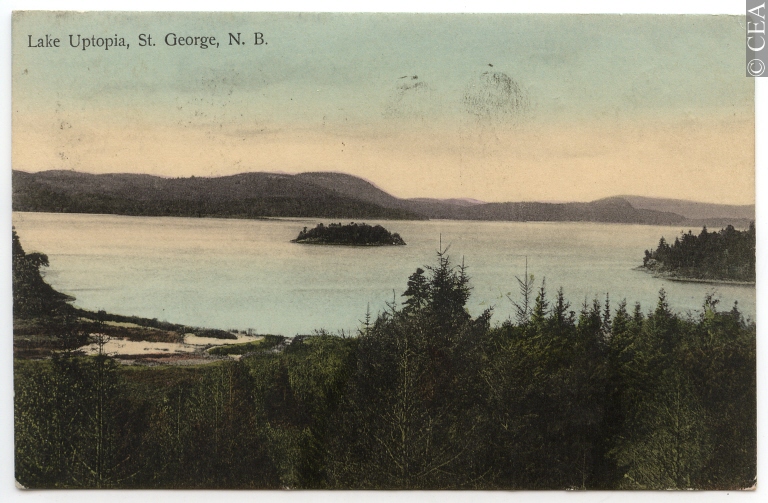
The first photo, a Post Card from 1908, demonstrates how low the water level once was in “The Marsh” area to the west of Woodbury’s Cove. In those days the meadow grass would be harvested for livestock feed. (This Postcard image from a Facebook post).
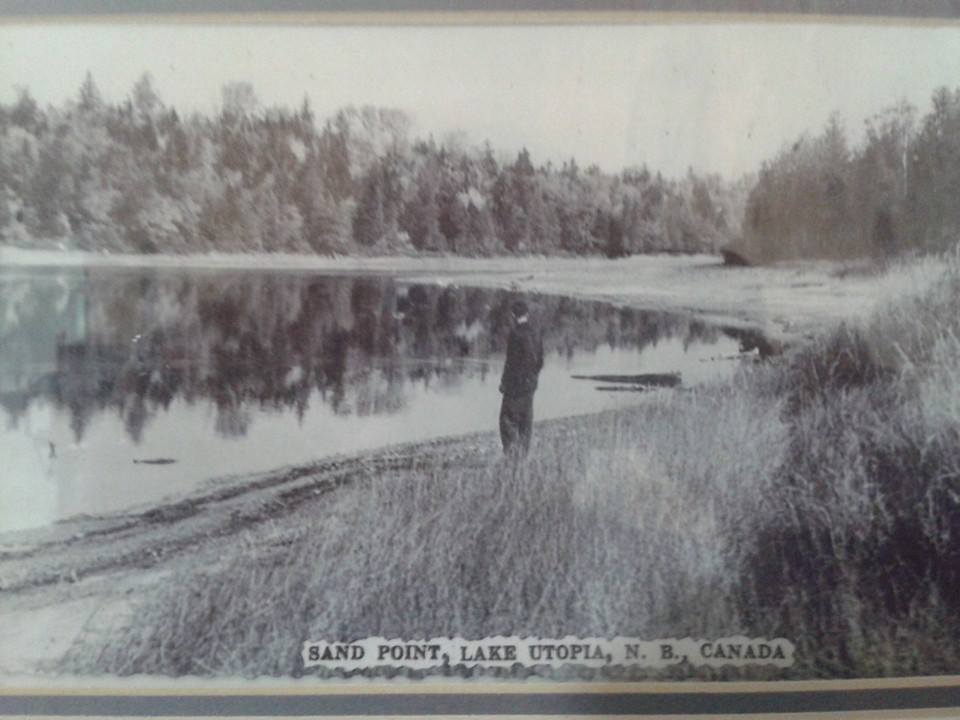
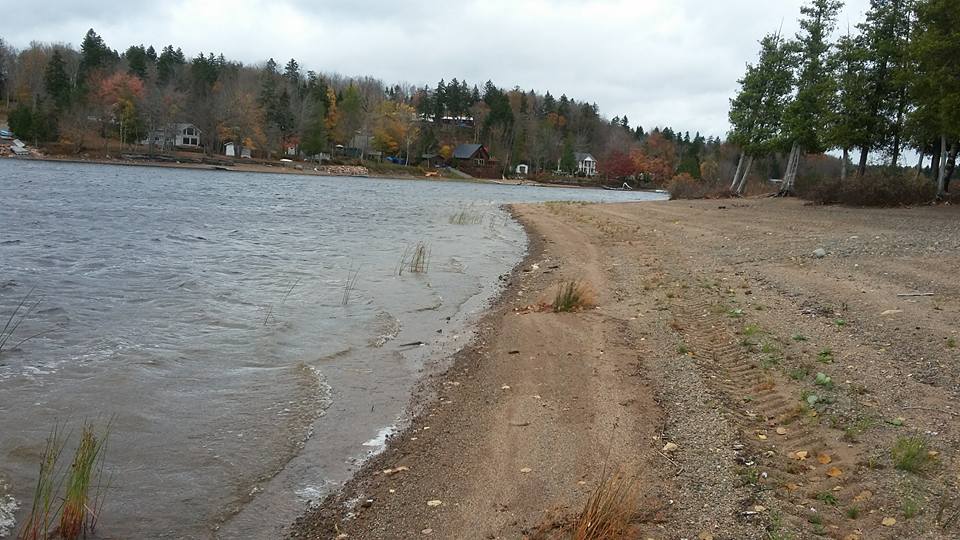
The last two photos depict the Sand Point area of Woodbury’s Cove today and yesteryear. (These photos of Sand Point are courtesy of the Hanselpacker family).